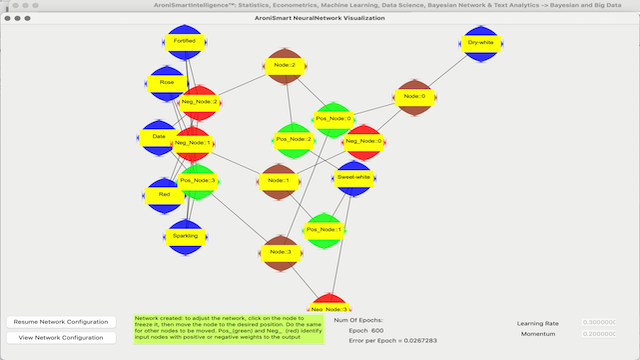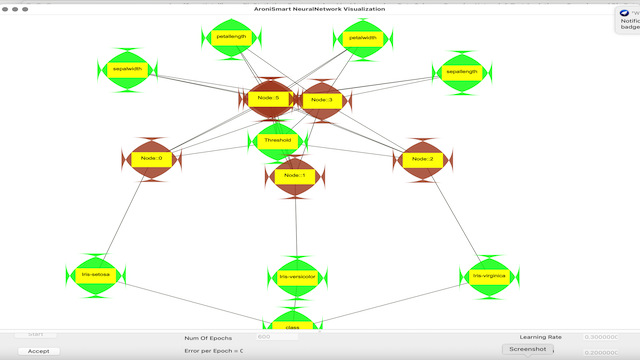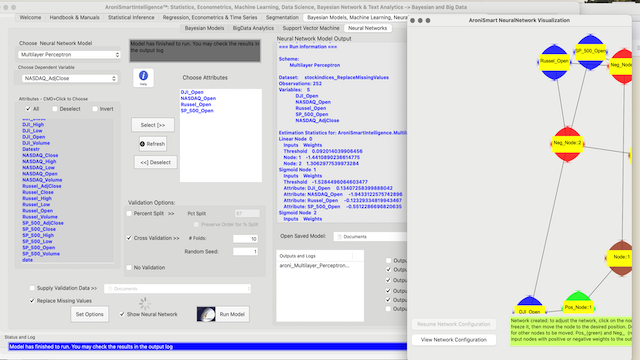
AroniSmartIntelligence Stock Market Indices Time Series Support Vector Machine and Neural Network Analysis
After a fueled momentum since Q4 2020, the stock market has experienced seesaw dynamics since late Q3 2021. The latest Q3 2021 stock market pefomance figures reminded of the increasing market volatility and other dynamics in late Q1 and early Q2, 2021. Major questions coming from AroniSmartIntelligence™ users have recently focused on how to use AroniSmartIntelligence capabilities to analyse the connection among the key Stock market indices, especially NASDAQ vs Dow Jones(DJI), S&P 500, and Russell 2000. AroniSmart™ team, leveraging the Machine Learning Time Series capabilities, including Support Vector Machine, and Neural Network Analysis of AroniSmartIntelligence™ , has analyzed the trends of NASDAQ vs the other stock indices (DJI, S&P 500, Russell 2000) between Q4 2020 and Q4 2021 and came up with insights and projections on the dynamics. The insights are presented below (for disclaimer and terms, check AroniSoft website. For related analyses of Stock Markets using Time Series, Dominance Analysis, and Neural Network capabilities see here AroniSmartIntelligence™ in Action: Apple (AAPL) Stock Performance and Momentum Analysis with Support Vector Machine and Dominance Analysis in Q3 2021) ( For More on AroniSoft LLC and AroniSmart products click here).
